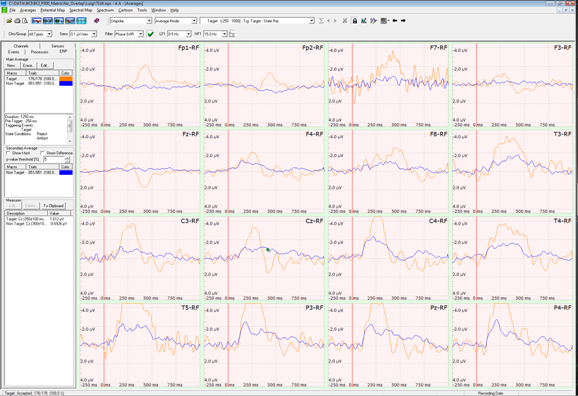
This window is dedicated to the viewing and analysis of the computed ERPs in the time domain. It looks like the following:
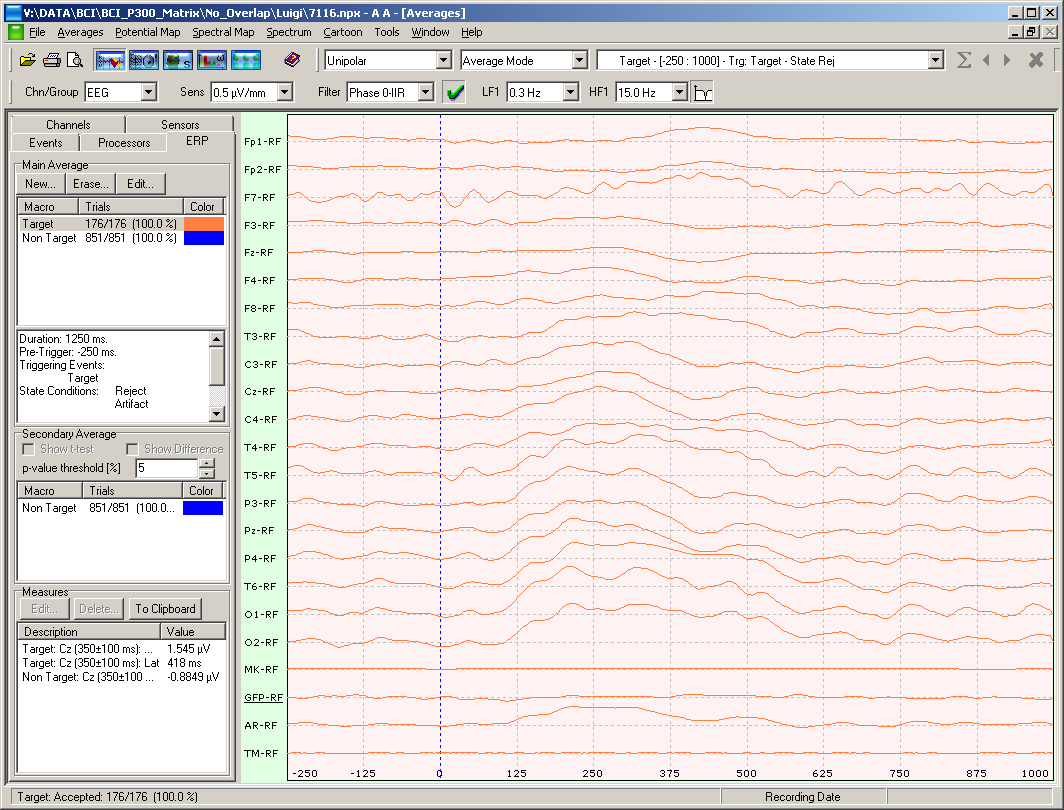
This window is decorated with a menu, two dedicated toolbars and a 5 pages sidebar (on the left side of the window). The main area shows the ERPs signals in the time domain.
Let’s examine them in details one by one.
This view provides two specific toolbars, which allow to set the visualization modality and some filtering options. The first toolbar appears as follows when in Average Mode:

One can set from left to right:
The second toolbar (see figure below), allows to set sensitivity (Sens) and filtering options for the channel(s) described in the leftmost combo box (Chn/Group). One can then set the filter type (IIR, including Zero-Phase, FIR, recursive, etc..), its state through a check like button that indicates if it is enabled or not, the cutoff frequencies of the band pass filter respectively LF, that is the Low Frequency (and not the Low Pass Filter!) and HF, that is the High Frequency (and not a High Pass Filter!) and a toggle button for enabling (pressed) or disabling (un-pressed) the notch filter.

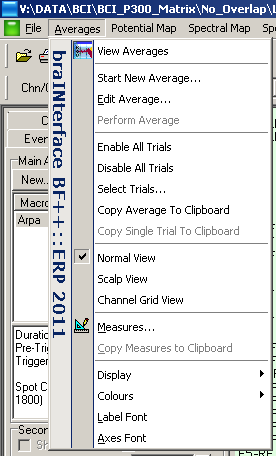
From the Averages Menu one can choose from the following commands:

This is useful for example if one wants to quickly select just a reduced set of trials or need a fine way to accept/discard every single trial. Selecting this will open a form that will show the accepted/rejected status of each trial. It is also possible to select / unselect trials from this list one by one. The list shows, for each trial, its progressive number, the eventual reason for its discarding (an artifact, a trial range such as in the moving averaging modality, or the user manually discarded it), the associated triggering event and the time of its occurrence relative to the beginning of the recording.
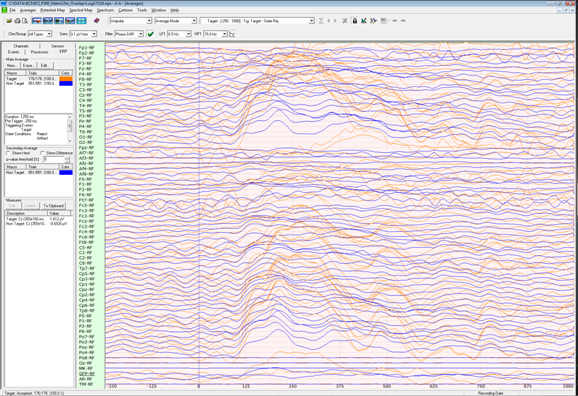
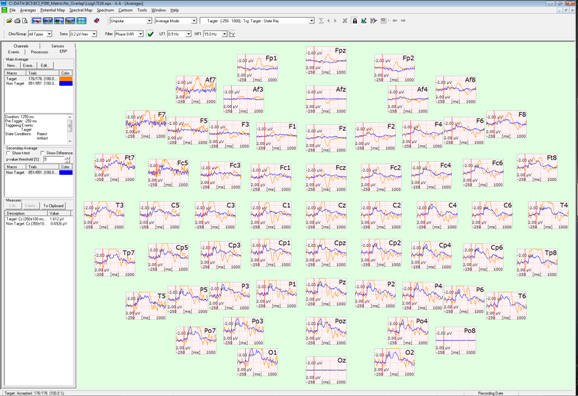
The Averages Sidebar is put on the left part of the main NPX Lab frame, and it is formed by 5 pages:
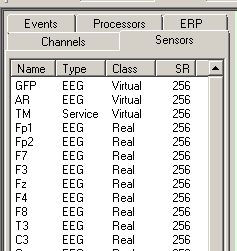
These include the name of the sensor, its type (e.g. EEG, MEG, ICA, EMG, etc..) its class, that is if it is a really acquired channel (Real) or if it was computed or generated by some built-in facility (e.g. the time marker, TM or the Global Field Power, GFP). In this case the sensors are called Virtual. Finally, the SR reports the sampling rate of the data.
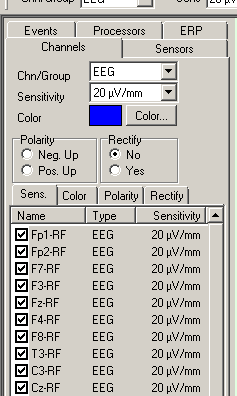
The options that one can set are:
Furthermore one can choose, for each channel, if it should be visualized or hidden (useful for removing noisy channels from the display).
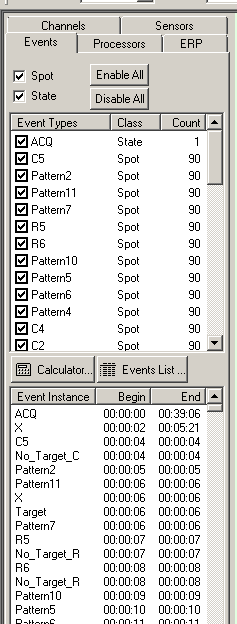
All the events can be filtered in and out in different ways: the Spot/State checkboxes (top left of the page) allows you to just consider some of them. Then, the checkboxes of the events types list allows to select which event instances should be included in the bottom list. So, for example one would just want to list the events of type Flash (which are of type Spot), the easier (and faster) thing to do is to press the Disable All button, which unchecks all the items in the Events Type list. After this the events instances list should be empty. And then check the corresponding Flash checkbox (there are 1080 of them in the file in the figure). After this, the events instances list will be populated by 1080 items, each of them indicating the begin and end of the occurrence of each event instance.
Two other buttons, the Calculator… and the Advanced… buttons will open the corresponding forms that allow you to create events from already existing ones (there are many very powerful functions in this form) and to review and make some processing on events (e.g. rename, delete, etc…) in a very fine way.
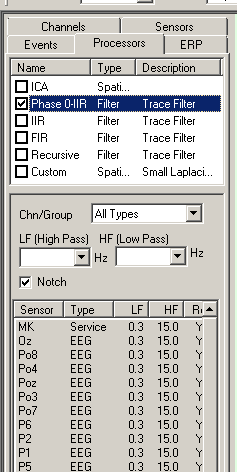
From this page you can enable the digital filter parameters (either IIR or FIR), you can define your spatial filtering settings (e.g. Small Laplacian) or you can enable/disable the Independent Component Analysis processors that allows, among others, to remove noise sources like ocular artefacts or power-line noise. Note that in order to use the ICA you need to have a NPX file with already computed ICA weights with the ICA Front End tool, that you can find (if you choose to install it, which is the default option) in the ICA group of your NPX Lab Suite menu (Start | Programs | NPX Lab | ICA | ICA Front End).
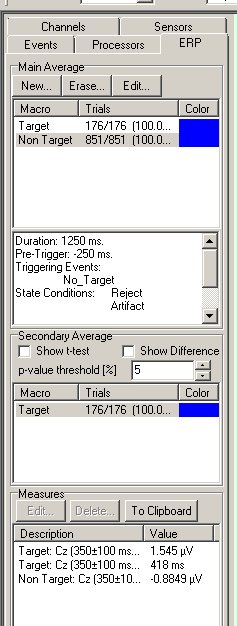
The first one is populated, from top to down, with the following items:
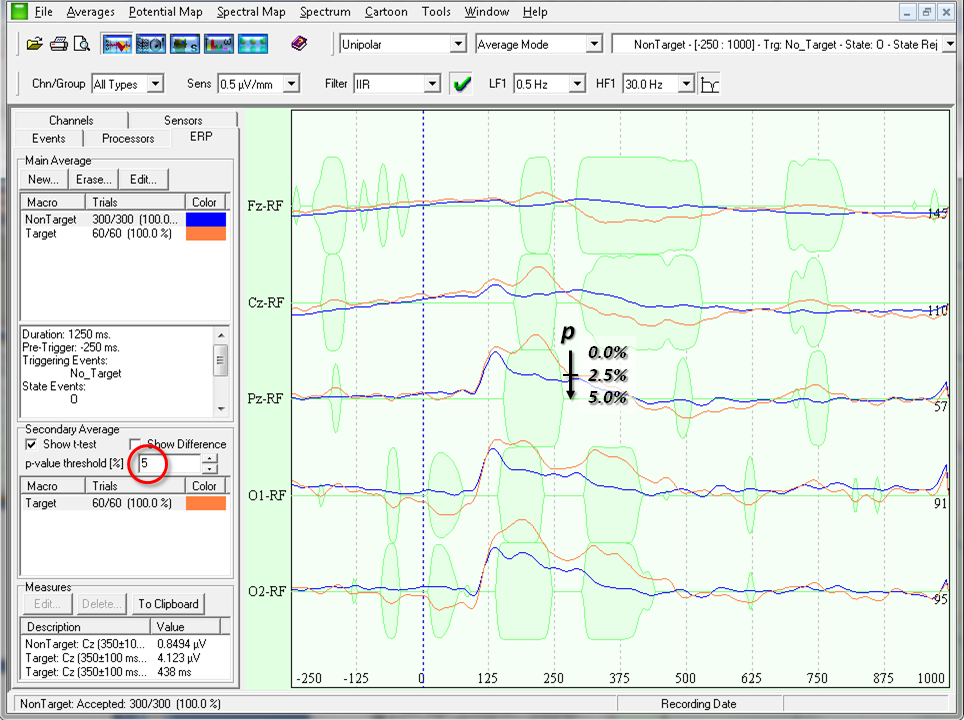
The Secondary Average group, instead, is used for the comparison of two averages, the one selected from the Main Average list and the one selected in the list of this group. Note that in this latter list only those averages that are “compatible” with the main average are displayed, that is only those who have been segmented with the same pre-triggering and duration time. If one wants to make a comparison of Targets and Non Targets ERPs in a P300 protocols, for example, then he should generate two averages with same pre-triggering and duration times and then select one of these from the Main Average list and the other from the Secondary Average list. The two averages will be then shown one over the other as in the right figure. Then, it will be possible to check the “Show t-test” and/or the “Show Difference” checkboxes. They will cause to show in the Averages view the p-values computed from the sample by sample t-test and/or the difference signal (main minus secondary averages) among the two selected averages. In fact, for each sample of each average, not only the mean value is computed, but also its standard deviation, so that each averaged sample actually represents a distribution. Then, it is possible to compare the corresponding samples of two averages because the necessary information to describe its distribution is also computed.
Green bubbles represent the statistical significance of the differences of the two signals: the isolectric line (e.g. 0 microvolts) represents values which are equal to the set threshold value (e.g. p = 0.05 in the figure) and p values greater than the threshold value are NOT displayed. The p = 0 value is set midway between two consecutive isolectric lines, as in the figure.
Created with the Personal Edition of HelpNDoc: Free HTML Help documentation generator