The P300 classifier is a tool of the NPXLab Suite (www.brainterface.com) that can be used to analyze and classify data used in P300 (and similar) based BCIs. Run the P3Classifier from the Windows Start Menu (Programs | NPX Lab | BCI | P3Classifier) and, after the form illustrated in Fig.1 appears, select a file to be analyzed (press the Load File button). Note that you need a file in NPX format to use this tool. If your file is stored in a different format you have to convert it with the File Converter from many different file formats (e.g. EDF, GDF, ASCII, Neuroscan, Brain Vision Analyzer, Micromed, EBNeuro, CTF MEG, Microsoft Wave Audio, HDF5, Biosemi, etc…).
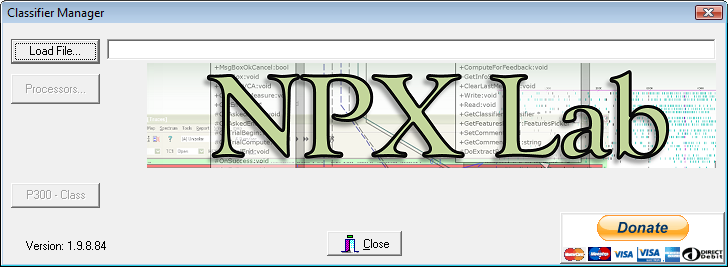
Fig. 1 – The P3Classifier startup form
After the file has been loaded, the “Processors...” and the “P300 – Class...” Buttons will be enabled. By pressing the Processors button you can enable/disable some processors (e.g. the IIR filter in Fig. 2 is activated) and set its parameters pressing the “Edit...” button (e.g. cutoff frequencies of the filters). It is more convenient to do the processing during the file conversion because the simulations performed with this tool will be much faster.
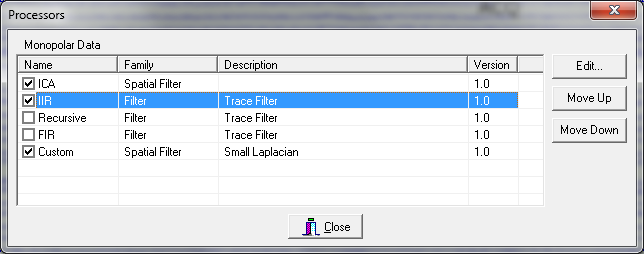
Fig. 2 – The Processors form
By pressing the “P300 – Class...” button, the most important form will appear (see. Fig. 3). There are eight main regions, numbered in the figure, which can be used to train and test the classifiers. The eight regions are respectively:
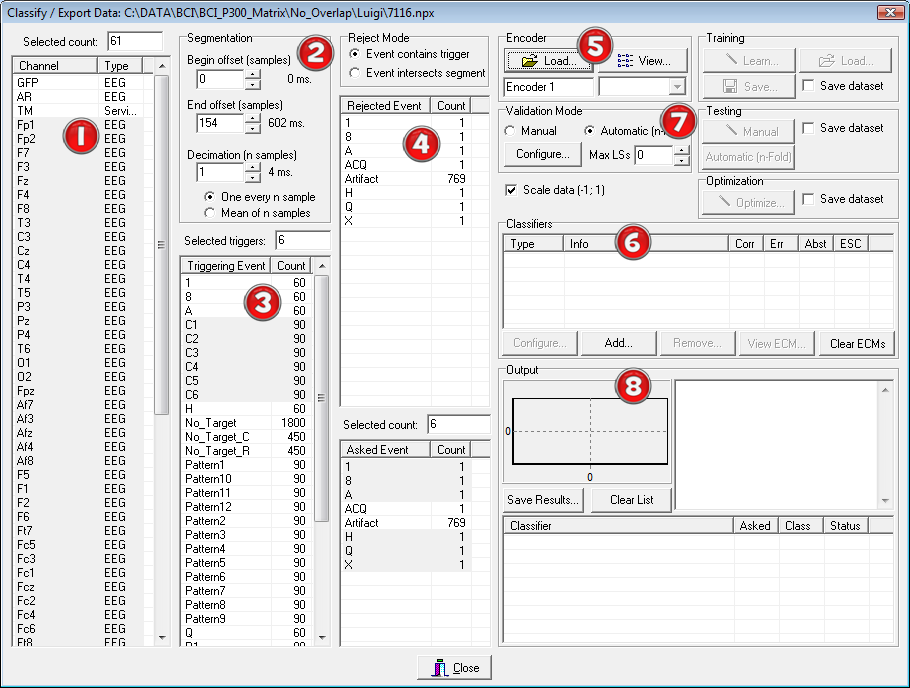
Fig. 3 – The main P3Classifier form
- The Channel selection list. In this list one can select the sensors to use for the classification. One is usually interested in finding a limited set of sensors that guarantee an adequate performance of the whole BCI system. This is because the training will be generally shorter and also the preparation of the recording (EEG electrodes need to be put on the scalp with a conductive gel) will be faster.
- The Segmentation panel. In this area one can select which time interval of the evoked responses will be used by the classifier. In P300 protocols a window of 0-600ms after the stimulation is commonly used. Furthermore, to reduce the number of features, a decimation factor can be set (a value of 1 means no decimation).
- The Triggering Event panel. Here the triggering events of the stimuli loaded from the file are listed. They will be automatically selected when an Encoder is loaded (see the Encoder panel explanation). One can then unselect specific events after the encoder has been loaded.
- The Asked Event panel. In this list the semantic symbols that one wanted to communicate are indicated. In the files it should be reported (through an event) which Semantic Symbols (SS) was asked to the user to execute (e.g. Motor Imagery, Computation, etc…). They will be automatically selected when an Encoder is loaded (see the following Encoder panel description). Some events could also be used to discard trials (4a). For example trials containing artifacts can be excluded from the training procedure and used in the testing one, etc…
- The Encoder panel. The CI is responsible of creating a map between Logical Symbols (LSs) and SSs. Once loaded, and knowing the event list stored in the file (asked SS symbols, triggering LS events), the program automatically evaluates which are the frequent (target) and rare (non target) stimuli. It also selects the proper LS and SS in the Triggering Events and Asked Events list boxes. Note that the events names selected for the analysis (triggers and asked) must match exactly those of the Alphabets (Logical and Semantic) used by the Encoder. In other words after the encoder has been loaded the programs looks for events whose names are the same of the symbols of the two alphabets. This is the way in which this tool can identify which are the target and non target events (from the encoder) and when they occurred in the file (from the events).
- The Classifiers panel. In this region one can select the classifiers to use and after running the validation procedure, their performances, according to the metric described in [Bianchi et al. 2007]. It is also possible to set some parameters relative to the various classifiers. By pressing the button “Add…” one can select which classifier to load (Fig. 4). Many classifiers can be used simultaneously or many instances of the same classifier can be used, each of them using different parameters (e.g. SVM with different kernels, etc…). Each classifier is handled as a separate plug-in according to the BF++ specifications, so that other classifiers can be used by the P3Classifier tool without the need of recompiling anything: a self registering mechanism will made them immediately available once they have been simply copied in the NPXLab Suite directory.
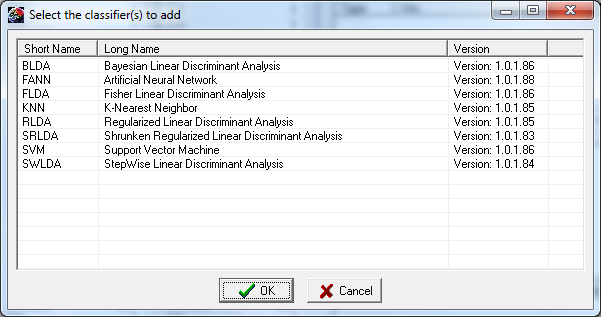
Fig. 4 – Add Classifier form
- The Validation Mode panel. In this region one can set the way the validation is performed: for example it is possible to decide how to select the data for the training and the testing, if the results should be saved into a file etc… Different options are accessible depending on the validation modality, that can be Manual (the operator decides which dataset to use for the training and which for the testing) or Automatic (n-Folded). By pressing the “Configure…” button a dialog box will appear that will allow to set all the parameters for the validation procedure. Depending on the validation modality some buttons in the Training, Testing and Optimization sub-panels are enabled or disabled: for example, when an encoder is loaded and the modality is Automatic, then the “Automatic n-Fold” button in the Testing subpanel is enabled.
- The main results of the classification are displayed in the bottom right part of the form and they can also be stored into an external file and reloaded into a spreadsheet or into other NPX Lab Suite tools to perform further processing (e.g. 2-D and 3-D topographic maps representation, performance optimization, etc…). Fig. 5 reports an example of the form after the validation procedure. For each classifier is reported the mean accuracy (Corr), the error rate (err), the abstentions rate (Abst), and the Estimated Selection Cost (ESC). Also the results of each single classification relative to a each classifier can be viewed: selecting an item in the bottom right list view (e.g. SWLDA – Scalar P(0.05 – 0.1)) the bar chart will be populated with the classification output: each bar represents the score relative to the classification procedure (its meaning varies depending on the used classifier) and is blue colored if it refers to a non-target symbol, while it is green, yellow or red if the classification is correct, abstained or wrong respectively.
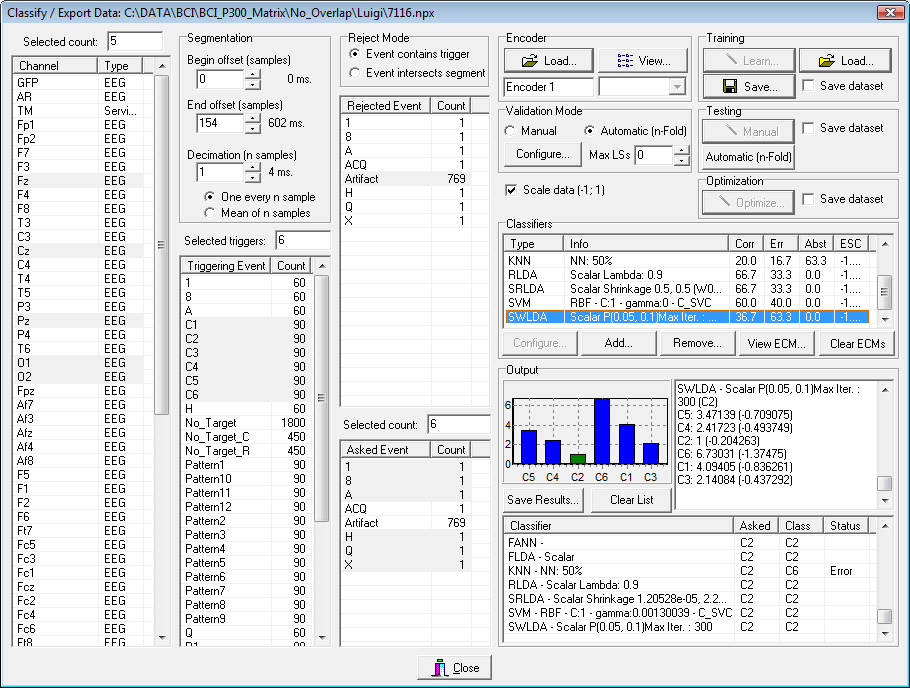
Fig. 5 – The main form after a validation procedure.
Furthermore, pressing the “View ECM“ button (ECM is the acronym for Extended Confusion Matrix) it is possible to view in details the results obtained by the validation procedure for each single classifier (Fig. 6).
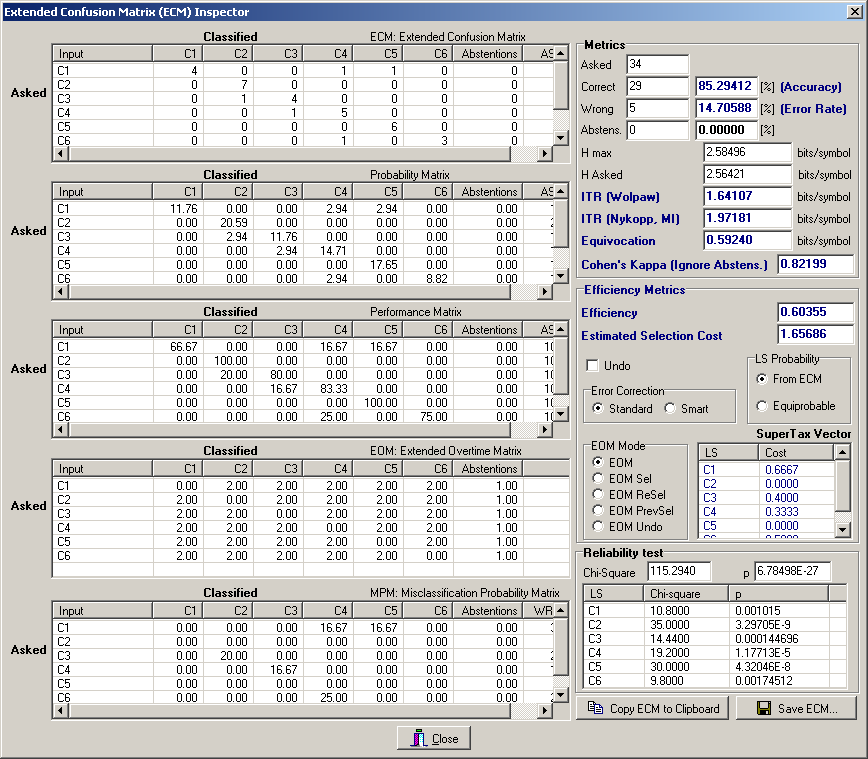
Fig. 6 – The Extended Confusion Matrix form.
From the ECM Inspector form one can immediately see the classifier performances according to many different metrics, such as Accuracy, Information Transfer Rate (ITR), Cohen’s Kappa, Entropy, Mutual Information, Efficiency (ESC) and have a detailed description, by inspecting the ECM, of the quality of the errors.
All these data, for each single classification, for each single classifier can also be exported, and used by the BF++ Toys in order to optimize the performances of complete applications.
Created with the Personal Edition of HelpNDoc: Free CHM Help documentation generator


