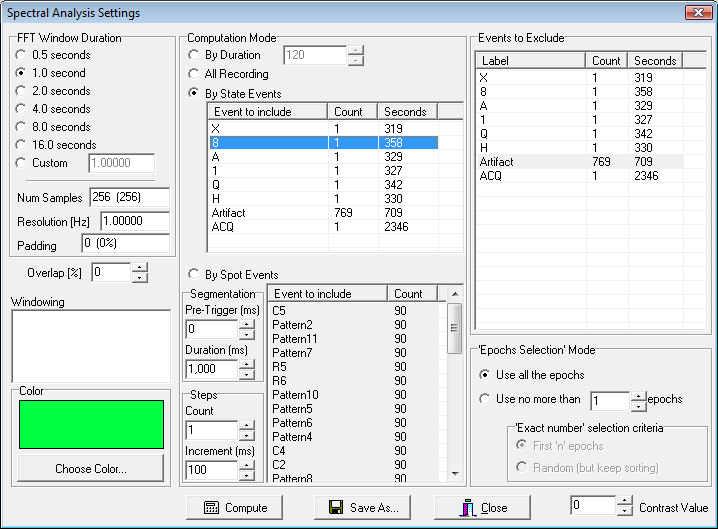
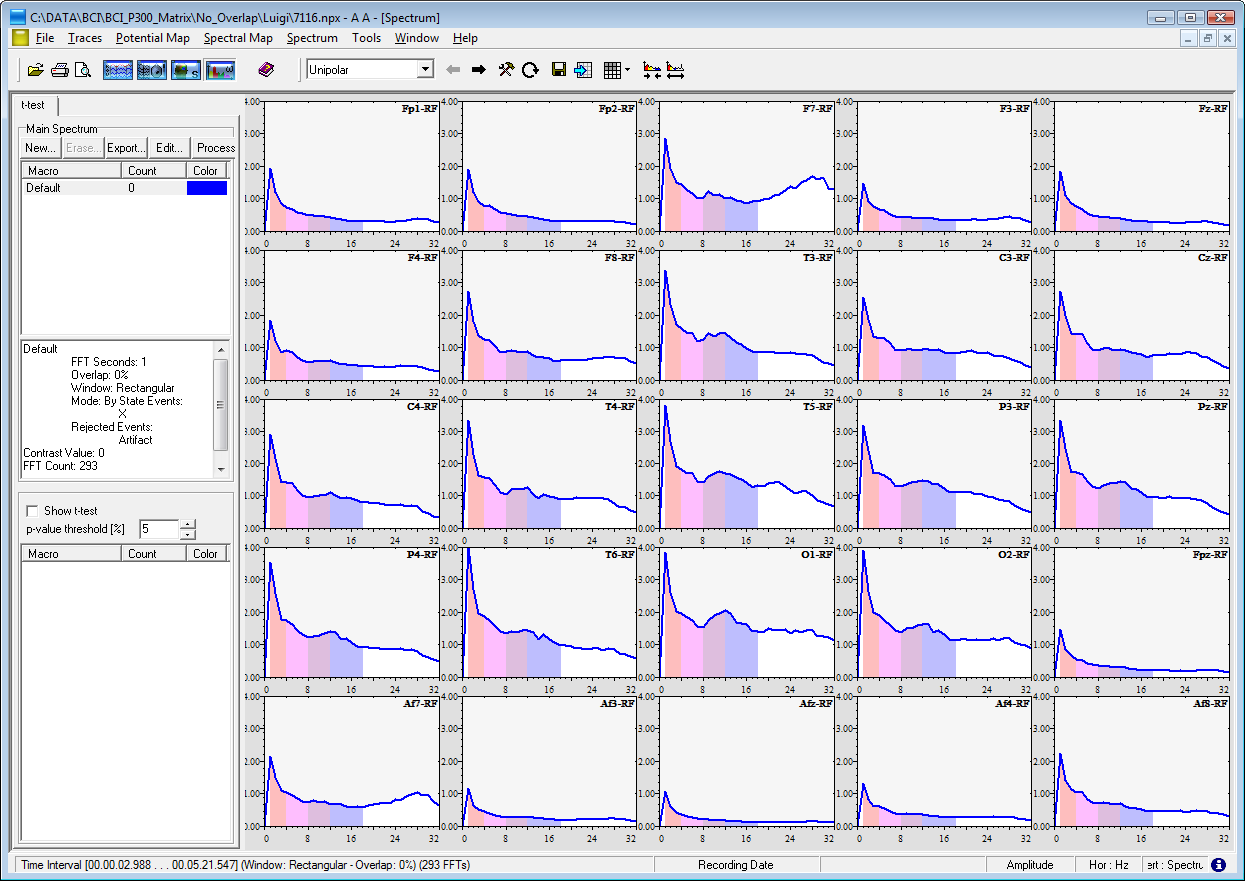
Spectral analysis can be computed on all the channels, being them either real (e.g. EEG, EMG, etc..) or virtual (e.g. ICA sources, Common Average Reference, Global Field Power, etc…) and with many options which allow to easily select and process only the desired data segment. The form for setting the FFT parameters is shown below.

It is possible to select data to be processed according to different strategies (a fixed duration, an event occurring), to exclude a part of them (e.g. process only the data in which the subject was in a rest state AND without artifacts), to set the FFT window length, function (Hamming, Hanning, etc…), overlap, etc.

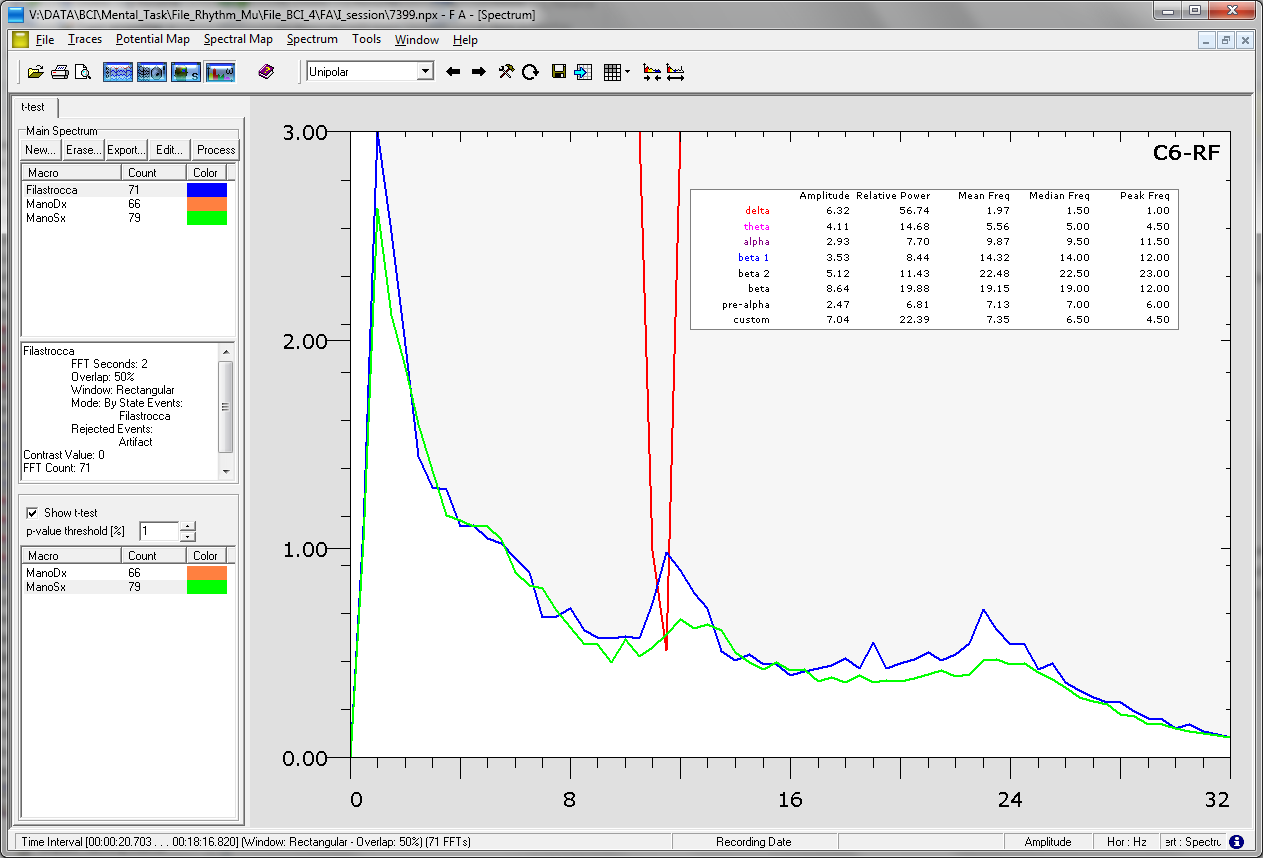
It is possible to perform the t-test, channel by channel, on two spectra, to compare them. On the left a screenshot of the comparison of two spectra is displayed. The two spectra are represented by the blue and green lines, while the red line indicates the p-value of the t-test applied, point to point, to the two curves. p-values are displayed just in the selected range (1% in the figure), so that they are visible only when the difference among the two spectra is statistically significative. It is possible to perform the t-test, channel by channel, on two spectra, to compare them.

Created with the Personal Edition of HelpNDoc: Easy CHM and documentation editor