The t-CWT tool is an application that implements the procedure described in [Bostanov V et Kotchoubey B, 2006] with a very friendly and simple user interface. In short, this method provides a statistical test to compare ERP components elicited by different classes of stimuli. It is based on the Continuous Wavelet Transform (CWT), which provides a sort of time-frequency description of a signal, and the t-Student test, which is a statistical procedure to compare two separate populations.
The algorithm can be shortly divided into the following main steps:
At the end of the procedure it is possible to identify the components (in both time and frequency domains) which are statistically different.
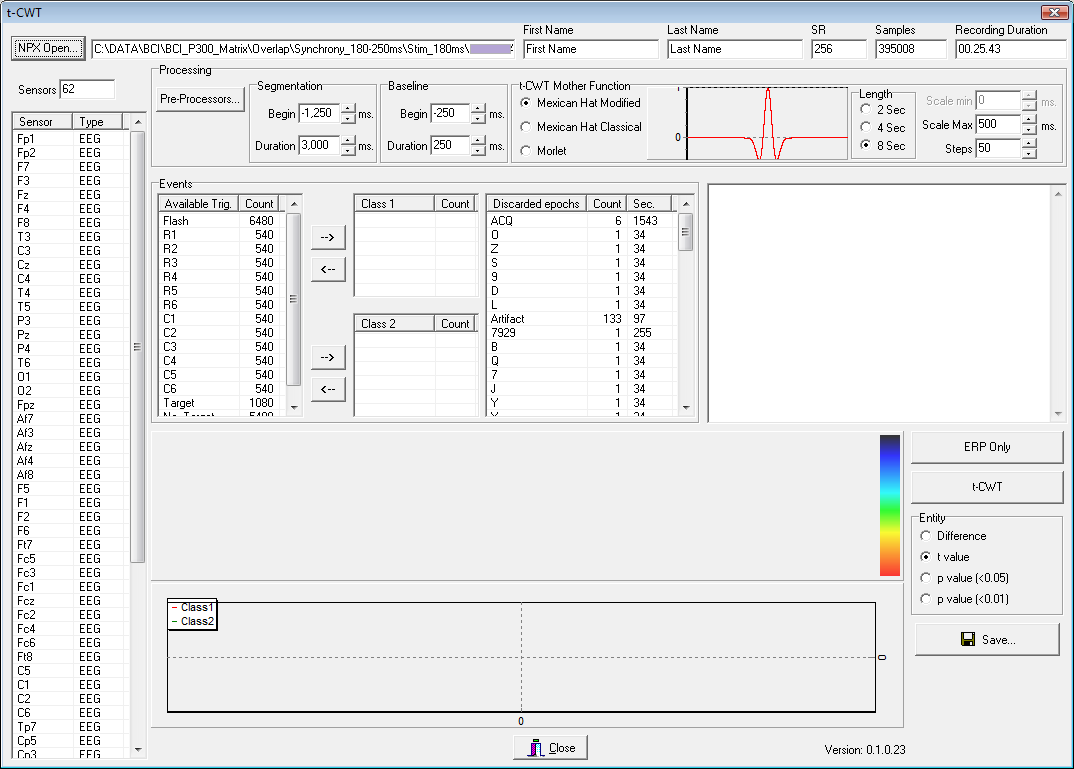
To apply this procedure with the t-CWT software tool of the NPXLab Suite, after having launched it, the user has to open a file to be processed. The file should be in NPX format with stored events relative to triggering functions (Spots in NPX Lab idiom) and, optionally, States to identify artifacts or EEG file portions to be excluded from the analysis. After the file has been loaded the main form will be populated similarly to the following figure:

The top part of the form is filled with some details relative to the file, such as its name, the name of the subject, the sampling rate, the recording duration, etc…
On the left list the name of the sensors are shown: the user has to select one of it to identify on which channel the analysis will be performed.
Then, from the group named “Events”, there are 4 main lists:
The software performs a comparison among two evoked responses, namely Class 1 and Class 2. These two lists have to be filled with events types, included in the “Available Trg” list. It is then necessary to select an event from the “Available Trg” list and press one of the “à” buttons to populate the corresponding list. After an event type has been added to a list it will disappear from the “Available Trg” list: it is not possible to use the same event type in both populations. To remove an event from the two classes lists it is sufficient to select it and press the “ß” button to move it back to the original list. The last list (“Discarded epochs”) allows to specify EEG portions (selections) to be excluded from the analysis (e.g. artifacts, training phase, etc...).
The Processing group include all the other main settings:
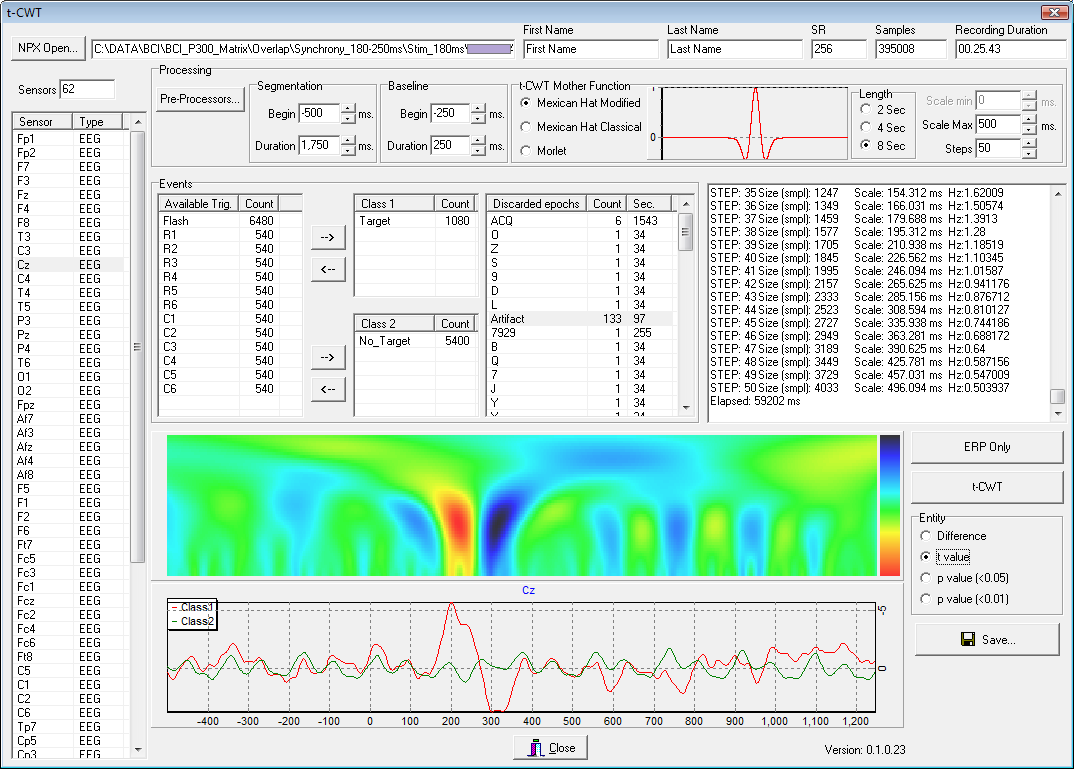
After having set all these parameters, it is possible to perform the t-CWT computation by pressing the "t-CWT" button. To just review the averages and compare them (without the t-CWT, using the classical ERP technique), it is sufficient to press the "ERP Only" button. Note that this last option is much faster with respect to the computation of the t-CWT. At the end of the t-CWT computation (which might require several minutes), the form will appear similarly to the following:

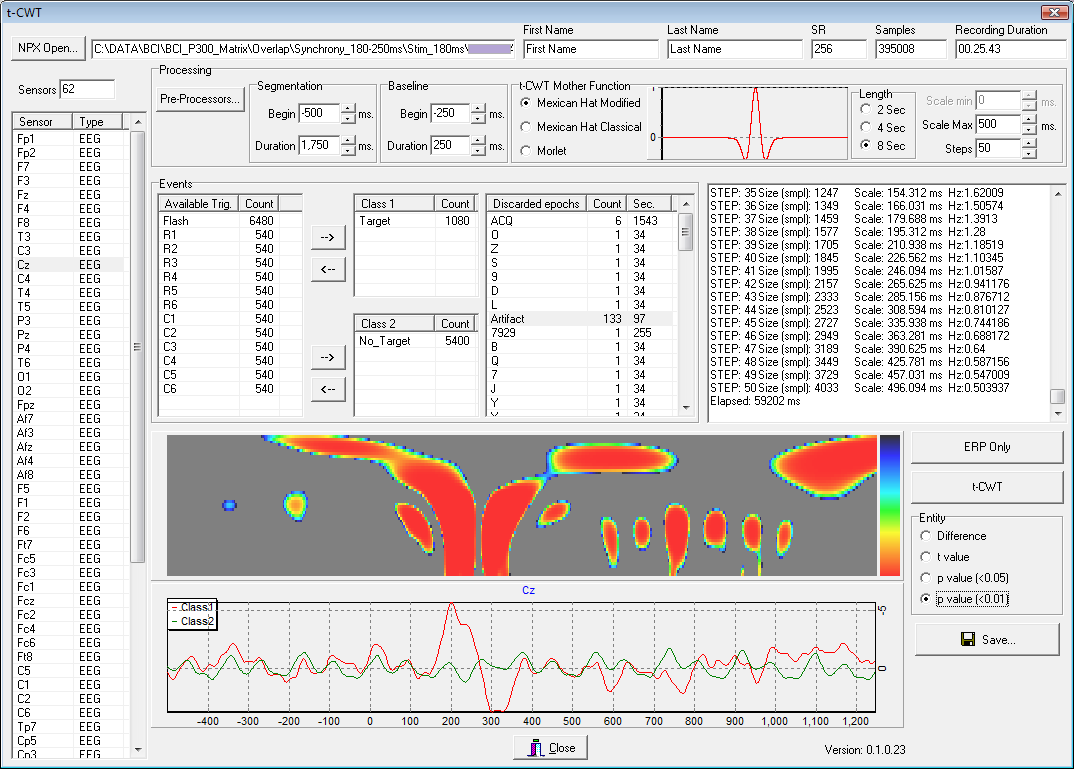
In this case the t-values are represented. By operating on the checkboxes placed on the right side of the scalogram, it is possible to plot the difference of the scalograms relative to the two classes of stimuli, as well as the statistical significance, represented by the p-value, as shown in the following figure:

In this case the red color indicates a p-value of 0, while a deep blue color represents a value of 0.01, which is considered as the threshold for statistical significance. p-values greater than 0.01 are represented in gray.
Finally, by pressing the "Save..." button it is possible to export to a ASCII file the plotted values (differences, t-values and p-values).
This tool, implemented within the framework of the DECODER project, is available for free to all the partners for the duration of the project.
References
Bostanov V, Kotchoubey B.,"The t-CWT: a new ERP detection and quantification method based on the continuous wavelet transform and Student's t-statistics", Clin Neurophysiol. 2006 Dec;117(12):2627-44. Epub 2006 Oct 6.
Created with the Personal Edition of HelpNDoc: Full featured EPub generator